

Two variables moving together does not automatically mean that one caused the other. To interpret a research claim correctly, examine the study design, timing, alternative explanations, effect size, uncertainty, and the exact language used by the researchers.
Key distinction: correlation describes a relationship observed in data. Causation means that changing one factor would produce a change in another under defined conditions.
What Is Correlation?
Correlation indicates that two measured variables vary together. A positive correlation means they tend to increase or decrease in the same direction. A negative correlation means that one tends to increase as the other decreases.
For example, researchers might observe that people who report more daily screen time also report fewer hours of sleep. This is an association in the collected data. By itself, it does not establish that screen use reduced sleep.
Correlation can be described with statistical measures such as Pearson’s correlation coefficient for linear relationships or Spearman’s rank correlation for monotonic relationships. More broadly, researchers may report associations through risk ratios, odds ratios, regression coefficients, or differences between groups.
What a correlation can tell you
- Whether two measured variables are related in a dataset
- The direction of an observed relationship
- The strength of the relationship under a particular statistical measure
- Whether a pattern deserves further investigation
What correlation cannot establish by itself
- Which variable came first
- Whether one variable produced the other
- Whether an unmeasured factor explains the pattern
- Whether the result applies outside the studied population
- Whether changing the suspected cause would change the outcome
What Is Causation?
A causal claim states that an exposure, treatment, policy, or behavior produces a change in an outcome. The relevant question is not simply, “Are these variables associated?” It is closer to, “What would happen to the outcome if the exposure were changed while other relevant conditions remained comparable?”
This idea is often expressed through a counterfactual comparison. Researchers would like to compare the same person, organization, or population both with and without an exposure at the same time. Because that comparison is impossible, causal research uses study designs and assumptions to estimate the missing alternative.
A statistical coefficient alone cannot establish causation. A causal conclusion also depends on participant selection, measurement quality, comparison groups, alternative explanations, and the credibility of the analytical assumptions.
Why Correlation Can Be Misleading
Confounding
A confounder is a factor associated with both the suspected cause and the outcome. Consider the familiar relationship between ice cream sales and drowning incidents. Both may rise during hot weather, but buying ice cream does not thereby cause drowning. Temperature and seasonal activity help explain the pattern.
Real research is usually less obvious. Age, income, baseline health, education, location, occupational exposure, and access to services can all create or distort associations. Statistical adjustment can help, but only for factors that were identified and measured adequately.
Reverse causality
Reverse causality occurs when the proposed outcome may influence the proposed cause. If a study finds an association between screen time and poor sleep, screen use might disrupt sleep. Alternatively, people who cannot sleep may spend more time using a screen. Both directions could operate simultaneously.
Cross-sectional studies, which measure variables at one point in time, are especially limited when the order of events is unclear.
Selection bias
Selection bias can distort an association through the way people enter or remain in a study. Volunteers may differ from non-volunteers. Participants who complete a long follow-up may differ from those who leave. A sample drawn from one clinic, platform, profession, or region may not represent the broader population.
Measurement error
Self-reported behavior, poorly calibrated instruments, vague survey questions, and inconsistent definitions can weaken a result. Measurement error may hide a genuine relationship, exaggerate one, or create misleading differences between groups.
Chance and multiple testing
A statistically significant result can still occur by chance. The risk becomes more important when researchers test many outcomes, subgroups, or models and report only the most striking findings. A p-value does not measure the probability that a causal explanation is true.
Coincidence and shared trends
Two variables may rise over time without being meaningfully connected. Population growth, inflation, technological adoption, and changing diagnostic practices can produce parallel trends. Time-series claims require particular care because a shared upward or downward pattern may create a strong-looking correlation.

Correlation and Causation Compared
| Question | Correlation or association | Causation |
|---|---|---|
| Core meaning | Variables differ or move together | Changing one factor produces a change in another |
| Required time order | Not necessarily established | The cause must precede the effect |
| Alternative explanations | May remain unresolved | Must be addressed through design, analysis, and evidence |
| Typical wording | Associated with, correlated with, linked to | Causes, increases, reduces, produces an effect |
| Main limitation | Cannot independently prove that an intervention would work | Depends on the validity of the design and its assumptions |
Which Study Designs Support Causal Claims?
Randomized controlled trials
Random assignment aims to create comparable groups before an intervention. When implemented well, it reduces confounding and can provide strong evidence about causal effects.
Randomization does not make every conclusion automatically valid. Attrition, non-adherence, weak outcome measurement, inadequate sample size, unblinded assessment, and selective reporting can still bias a trial. The result may also apply only to the population and conditions studied.
Observational studies
Cohort, case-control, cross-sectional, and other observational studies do not assign the exposure. They are often necessary when experiments would be unethical, impractical, or too expensive.
These studies can support causal inference when they establish time order, measure key confounders, use an appropriate comparison group, and test the sensitivity of results to alternative assumptions. However, claims should reflect the study’s remaining limitations.
Natural and quasi-experiments
Policy changes, eligibility thresholds, geographic boundaries, and external events can sometimes create comparison groups that resemble an experiment. Methods such as difference-in-differences, regression discontinuity, and instrumental variables may estimate causal effects when their specific assumptions are defensible.
The method’s name is not enough. Readers should ask whether the comparison was genuinely credible and whether other changes occurred at the same time.
Systematic reviews and triangulation
Confidence increases when findings are reproduced across populations, methods, datasets, and research teams. A systematic review can organize the available evidence, but its conclusion still depends on the quality and comparability of the included studies.
Different methods have different weaknesses. When several approaches point toward a similar conclusion despite those differences, the combined case may be more persuasive than any single result. These questions belong to the broader field of research methods.
How to Evaluate a Research Claim Step by Step
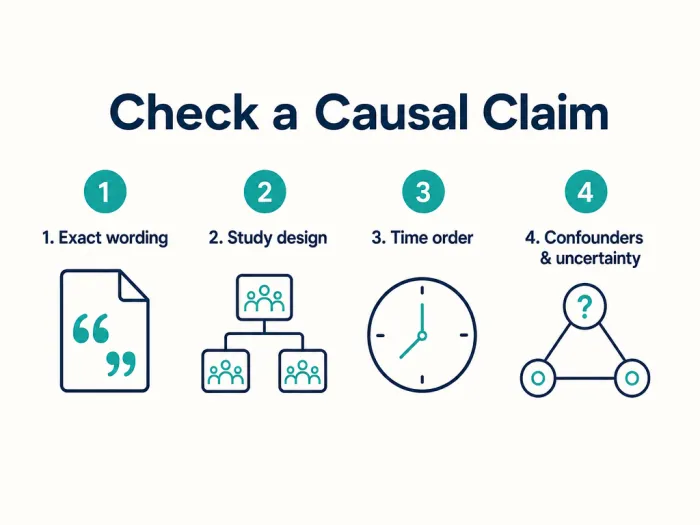
- Identify the exact claim. Determine the proposed cause, outcome, population, comparison, and time period.
- Check the wording. Compare the headline with the language in the study. “Linked to” is not equivalent to “caused by.”
- Find the study design. Was this a randomized trial, cohort study, survey, case-control study, natural experiment, or laboratory experiment?
- Confirm the time order. The proposed cause must occur before the outcome for the stated causal direction to be plausible.
- Look for a comparison group. Ask whether the groups were meaningfully comparable before the exposure or intervention.
- List plausible confounders. Note which were measured, how they were handled, and which may remain unmeasured.
- Examine the effect size. A result can be statistically significant but too small to be practically important.
- Read the uncertainty interval. Confidence intervals show the range of effect sizes reasonably compatible with the model and data.
- Check robustness. Stronger results persist across reasonable definitions, models, exclusions, and sensitivity analyses.
- Assess generalizability. A finding in one population or setting may not apply to everyone.
A Worked Example: Screen Time and Sleep
Suppose a headline says, “Screen time causes poor sleep.” The underlying study surveyed adults once and found that participants reporting more evening screen use also reported shorter sleep.
The data support an association, but several questions remain:
- Did increased screen use occur before sleep problems began?
- Did people use screens because they were already unable to sleep?
- Could work schedules, stress, caregiving, caffeine, or health conditions influence both variables?
- Were screen use and sleep measured objectively or estimated from memory?
- Was the difference substantial enough to matter in daily life?
A stronger investigation might measure behavior over time, establish baseline sleep, account for relevant confounders, and compare a defined reduction in evening screen exposure with a suitable control condition. Even then, the conclusion should specify the population, intervention, duration, and measured outcome rather than claiming that every type of screen use affects every person identically.
Statistical Significance Is Not Causal Significance
A p-value addresses how compatible the observed data are with a statistical model under specified assumptions. It does not show that the research hypothesis is true, prove that bias is absent, or establish causality.
Readers should consider three separate issues:
- Statistical uncertainty: How precise is the estimate?
- Practical importance: Is the estimated effect large enough to matter?
- Causal validity: Could bias, confounding, reverse causality, or measurement problems explain it?
Sample size also matters. A very large study can identify a tiny difference with limited practical value, while a small study may produce an unstable estimate with a wide confidence interval.
Statistical significance, practical importance, and causal validity are different questions. A convincing research claim must distinguish between them.
Useful Causal Clues That Are Not Proof
Researchers often consider temporality, consistency, effect magnitude, dose-response patterns, biological or behavioral plausibility, and evidence from interventions. These considerations can strengthen or weaken an interpretation, but they are not a mechanical checklist that converts an association into proof.
Causal diagrams, often called directed acyclic graphs or DAGs, can make assumptions explicit. They help researchers decide which variables may be confounders, mediators, or consequences of both exposure and outcome. A diagram improves reasoning only when its assumptions are credible.
Important nuance: correlation is neither sufficient nor always necessary for causation. A causal effect may be obscured by opposing subgroup effects, nonlinear relationships, measurement error, or aggregation. The real task is to evaluate a clearly defined causal question.
How Research Claims Function as Arguments
A research claim is an argument built from data, design choices, assumptions, and prior knowledge. The appropriate response is neither to dismiss every correlation nor to accept every significant result. Readers should ask what was measured, which alternatives were addressed, and how closely the evidence supports the words being used.
This evaluation also depends on the quality and relevance of the material selected. The principles used to assess research resources can help distinguish directly relevant evidence from material that only appears related.
Quick Checklist for Reading a Claim
- Does the headline match the study’s actual conclusion?
- Is the claim causal or merely associative?
- What type of study produced the result?
- Did the proposed cause occur before the outcome?
- Were the comparison groups similar?
- Which confounders were measured, and which may be missing?
- How were the exposure and outcome measured?
- What is the absolute effect, not only the relative effect?
- How wide is the confidence interval?
- Were many outcomes or subgroups tested?
- Has the result been replicated with other methods or populations?
- Do the authors acknowledge limitations and competing explanations?
Mini FAQ
Does a strong correlation prove causation?
No. A strong correlation can still result from confounding, selection bias, shared trends, or reverse causality. Strength may make an association interesting, but it does not replace a credible causal design.
Can a weak correlation still reflect a causal effect?
Yes. Effects can vary between individuals, be diluted by measurement error, or depend on context. A small average effect may also matter when an exposure is widespread or an outcome is serious.
Does a randomized trial always prove causation?
No. A well-conducted randomized trial can provide strong causal evidence, but implementation failures, attrition, measurement problems, chance, and limited applicability can weaken its conclusions.
Can observational research identify causal effects?
It can support causal conclusions when the design, comparison, timing, measurements, and assumptions are sufficiently credible. The remaining risk of unmeasured confounding should be discussed rather than ignored.
What is the difference between relative and absolute risk?
Relative risk compares rates proportionally, while absolute risk describes the actual difference in rates. An increase from 1 case to 2 cases per 10,000 is a 100% relative increase but an absolute increase of 1 case per 10,000. Both measures are needed for context.
What is the fastest warning sign in a headline?
Look for causal verbs such as “causes,” “prevents,” “drives,” or “leads to.” Then determine whether the underlying research actually used a design capable of supporting that language.